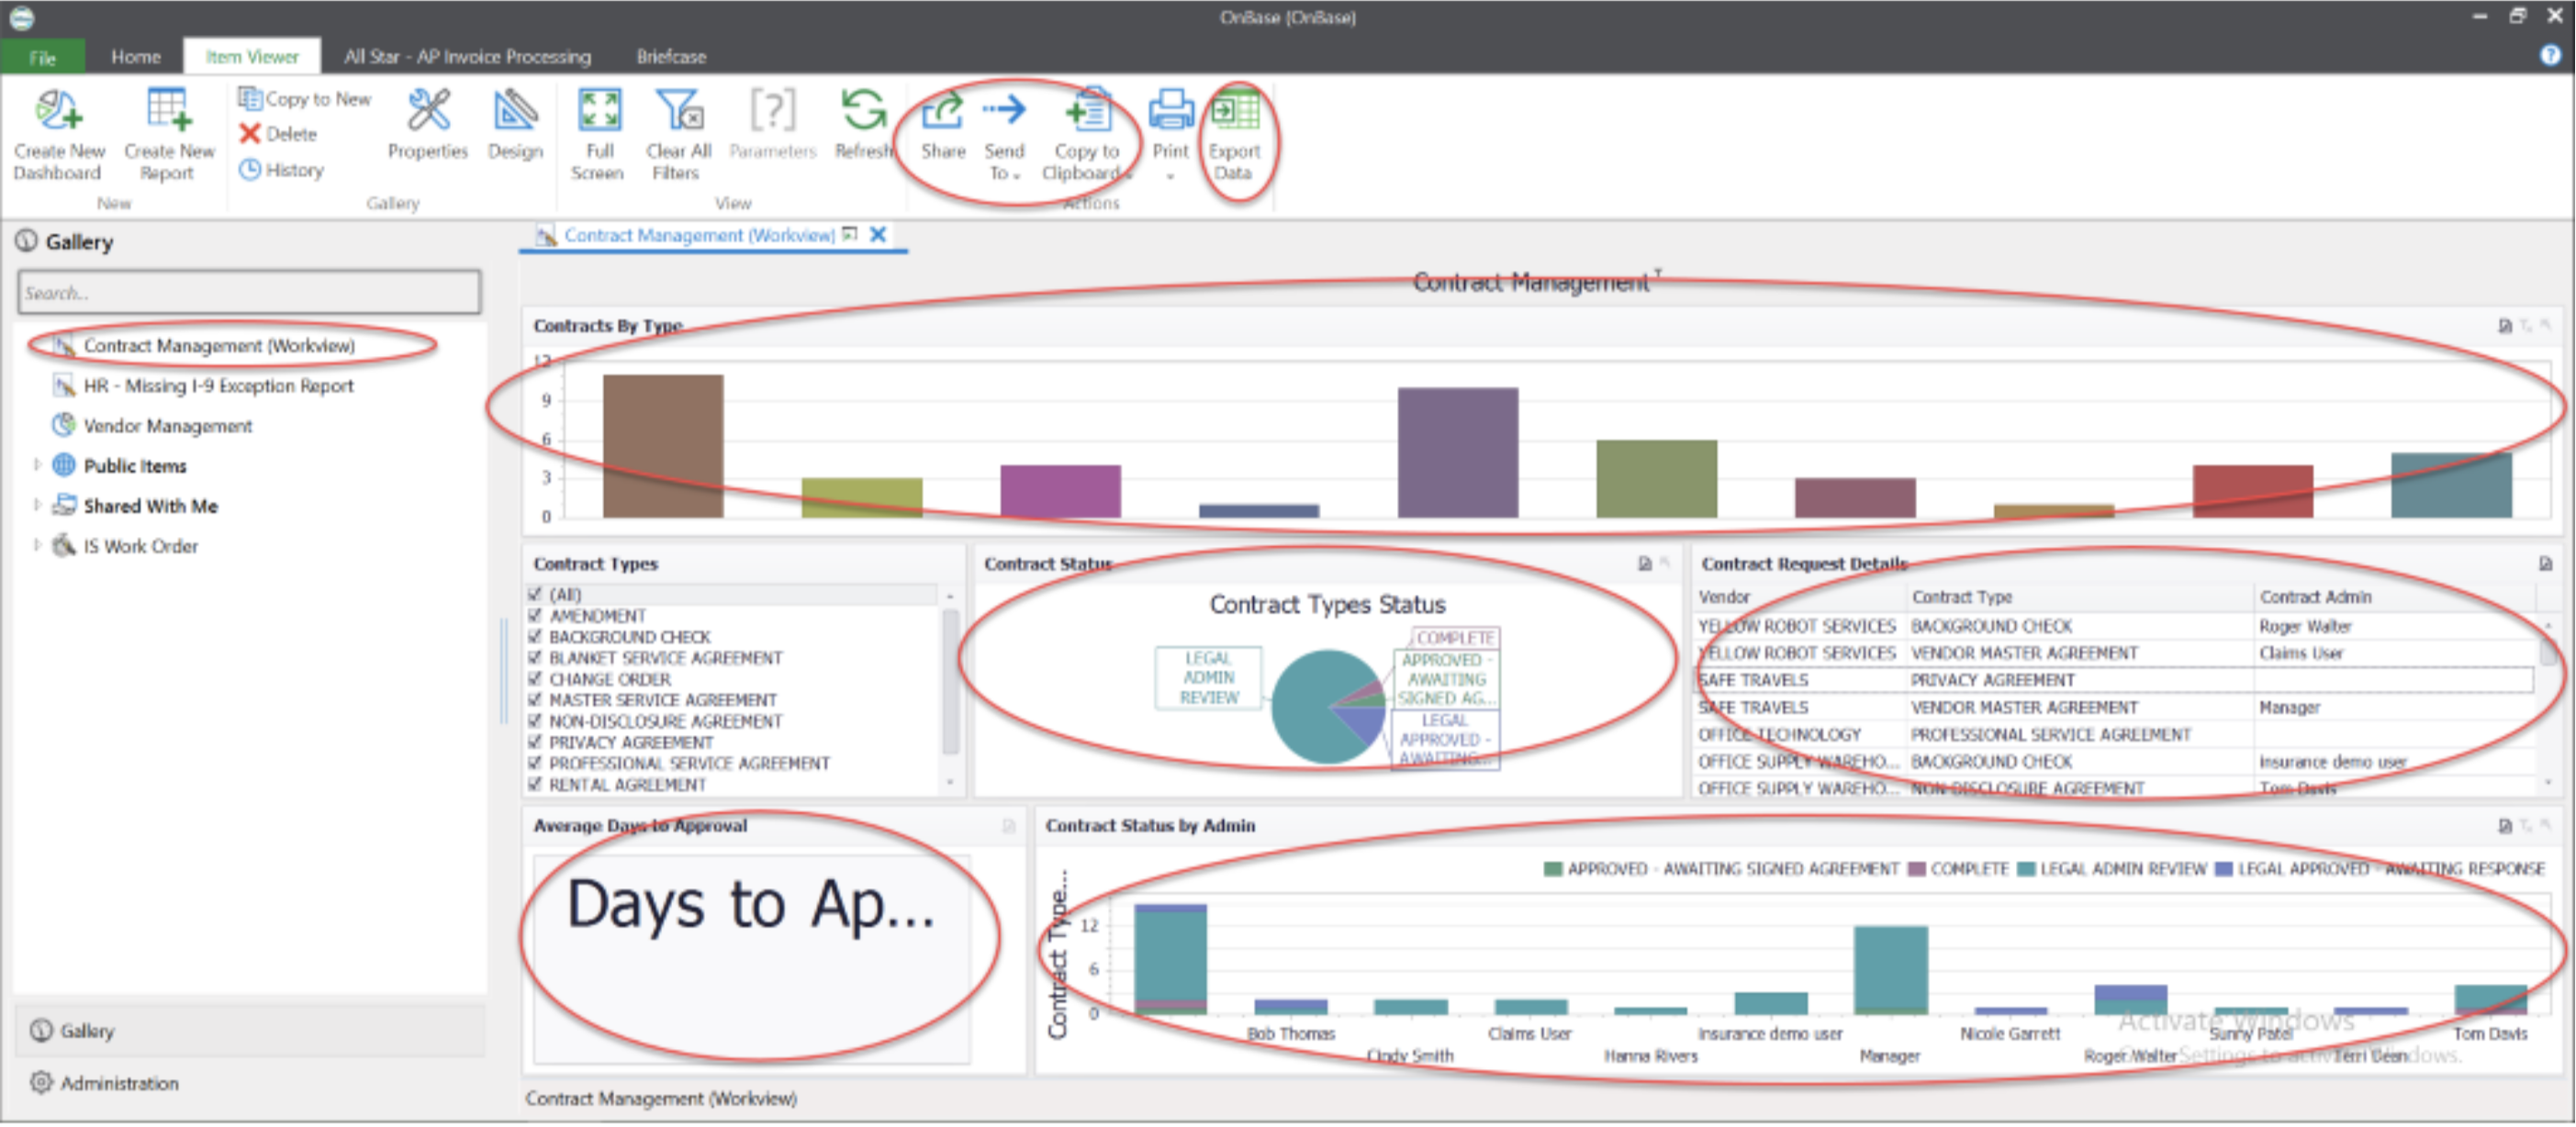
Reporting Dashboards is used to graphically display data returned from a configured data provider as a dashboard, or display data as easily categorized and sorted reports. Dashboards can contain multiple dashboard items including basic pie, chart, and bar graphs, or more advanced displays such as gauges, pivot tables, and maps, all of which allow users to quickly identify relevant information and trends surrounding the data managed by the data provider.
Multiple dashboard items can be displayed in a single dashboard, and the dashboard can be configured to allow the elements of one dashboard item to update the information displayed in other dashboard items, allowing for a dynamic, real-time view of measurements surrounding stored data.
Data returned for a dashboard is displayed in an easy-to-configure graphical interface that can contain dynamic and interactive dashboard items. Dashboard items, parameters, display options, and interactivity are all configured using the dashboard designer. Data returned for a report is displayed using select columns that can be used to categorize and sort data, providing specific insight into the information being presented.
Full Reporting Dashboards functionality is only available in the OnBase Unity Client. Dashboards can also be viewed in the OnBase Web Client with limited functionality.
Dashboards and reports can also be accessed from web browsers, including mobile web browsers, using the optional Reporting Dashboards Web Viewer. The Reporting Dashboards Web Viewer allows access to dashboards and reports for users who do not have access to the OnBase Web Client or Unity Client.
Anyone who needs interactive, real-time reporting surrounding data contained in an OnBase system will benefit from Reporting Dashboards. Users who require detailed and dynamic views of their business data can, through an interactive graphical display, immediately view that data and how it relates to other meaningful data, allowing them to make decisions based on it more quickly, or generate moment-in-time snapshots of data for historical purposes.